Prepare the satellite inputs
Remove cloudy pixels. Use six visible and infrared bands to measure vegetation, moisture and built-surface patterns, including nearby areas.
INPUT: REFLECTED LIGHT StrataSAN JOSÉ LANDSAT STUDY
YOUTH FOR EARTH
Paved school surroundings, shopping areas and streets with little vegetation can trap surface heat. Explore San José’s satellite evidence to find places worth investigating for shade and greening.
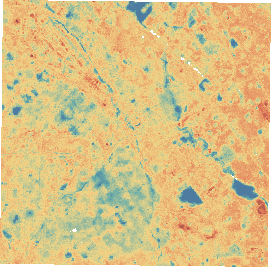
Explore the heat map ↗of San José studied using
real Landsat observations
A machine-learning study of surface heat, tested on later satellite images.
01 / FROM SATELLITE DATA TO A TESTED MODEL
Landsat is NASA and the U.S. Geological Survey’s Earth-observing satellite program. Its images capture reflected sunlight and heat emitted by the ground.
Remove cloudy pixels. Use six visible and infrared bands to measure vegetation, moisture and built-surface patterns, including nearby areas.
INPUT: REFLECTED LIGHTPair earlier light readings with known surface temperatures. Our model learns patterns connecting reflected light with relative surface heat. Open the technical details to see its settings.
TRAINING ANSWER: THERMAL DATAEstimate heat in two unseen 2025 images using reflected light alone. Compare the estimates with the satellite’s withheld thermal readings.
OUTPUT: °C ABOVE OR BELOW THE IMAGE MEDIANCan reflected light recover surface-heat patterns? Thermal readings are evaluation targets, not input features. The observed map is available directly for this date; ML is not required to view it.
ExtraTrees uses 220 trees, minimum leaf size 3, six reflectance bands, four spectral indices, and 90/270 m neighborhood context. Eight earlier images train the model; two later images test it. A separate spatial check withholds 600 m blocks.
02 / MEASURED PERFORMANCE
Baseline: predict the scene median at every location.
Among locations flagged in the hottest fifth:
A match means a location was also in the satellite-measured hottest fifth. These results come from the later 2025 images.
This check holds out 600 m blocks in the training-year images. It is separate from the two later test dates above.
Loading spatial comparison…
03 / EXPLORE YOUR SURROUNDINGS
Choose a place or click the map. Compare the surrounding 300 m, then explore which hot, low-green areas qualify for field review.
Loading satellite observations and places…
04 / FROM EVIDENCE TO ACTION
Use hot, low-green areas as a starting point for investigating urban shade and greening. A map is the beginning of a site assessment.
flagged for review
10.5% of the mapped area
154.8 km² studied → 16.2 km² flagged
Source-grid area from the original analysis. Custom controls never alter this archived total. No cooling benefit has been measured.
A DOCUMENTED LOCAL COMPARISON
Loading the satellite comparison…
Current field observations: not collected. The satellite image was acquired on August 31, 2025; it does not establish current site conditions.
Proposed follow-up: check shade, paved surfaces, planting space and local priorities at each location. A cooler observed area can still be informative; the comparison does not prove vegetation caused the difference.
Replaces the current comparison. Use “Undo selection change” on the map to restore it.
YOUR PLANNING OUTPUT
Add one to three areas on the map to prepare a brief. Explore the map ↗